Microservices Part 3: Autoscale Under Load
Part 3 of Microservices on Light Cloud. Push one service until Light Cloud adds instances, read what happened, and fix the two limits that surprise everyone: requests per instance and database connections.



On this pageShowHide
- What you will build
- Before you start
- Step 1: Get the Part 3 code
- Step 2: Read the scaling controls
- Step 3: Set a ceiling of 5 instances
- Step 4: Install oha
- Step 5: Run the load test
- Step 6: Watch it scale
- Step 7: Read the results
- Step 8: Keep the database safe when scaling out
- Step 9: See who changed the scaling
- Troubleshooting
- FAQ
- Next steps
To see autoscaling on Light Cloud, give a service a ceiling with Max instances, send it more work than one instance can handle, and watch Running now and the Metrics tab: Light Cloud adds instances while they are busy and removes them when the work stops. How quickly it helps depends on two settings people rarely check, Concurrency (requests one instance takes at once) and the database connection pool, and on the edge rate limit that caps how hard one machine can push.
This is Part 3 of the series. It uses the Bean There shop from Part 1 and Part 2, and loads only catalog-api.
What you will build
A two-minute load test against catalog-api that takes it from zero instances to five, and the changes that make scaling behave:
- A deliberately expensive endpoint,
GET /work?ms=500, that keeps the CPU busy like a report or an image resize would, and answers with the id of the instance that served it. - A cap on database connections per instance, so more instances never overwhelm the database.
- A clear
503 Database busyanswer instead of a bare error when the database is full.
Source code: github.com/light-cloud-com/tutorial-microservices, tag part-3.
Before you start
- Bean There deployed from Parts 1 and 2.
- A terminal with curl (
curl.exein PowerShell 7 on Windows). You will install one tool, oha, a small open-source load tester, with Homebrew on macOS or winget on Windows. - About two minutes of load costs a little usage. On paid plans usage comes out of what the plan includes first.
Step 1: Get the Part 3 code
Sync your fork (Sync fork, then Update branch on GitHub) or pull from a clone:
$ git pull upstream main
$ git push origin mainPS> git pull upstream main
PS> git push origin mainOnly catalog-api/ changed, so only catalog-api redeploys. When it is live, the new endpoint answers:
$ curl "https://main-catalog-api-yourworkspace.light-cloud.io/work?ms=10"
{"service":"catalog-api","instance":"17ab13e6","worked_ms":10}PS> curl.exe "https://main-catalog-api-yourworkspace.light-cloud.io/work?ms=10"
{"service":"catalog-api","instance":"17ab13e6","worked_ms":10}Your instance id will be different: each running copy of the service picks a random one when it starts.
This is the endpoint:
// Deliberately expensive: keeps the CPU busy for ?ms= milliseconds (max 2000),
// like a report or an image resize would. Used to watch autoscaling.
app.get("/work", (req, res) => {
  const ms = Math.min(Math.max(Number(req.query.ms) || 100, 1), 2000);
  const until = Date.now() + ms;
  let spins = 0;
  while (Date.now() < until) spins++;
  res.json({ service: "catalog-api", instance: INSTANCE_ID, worked_ms: ms });
});
Step 2: Read the scaling controls
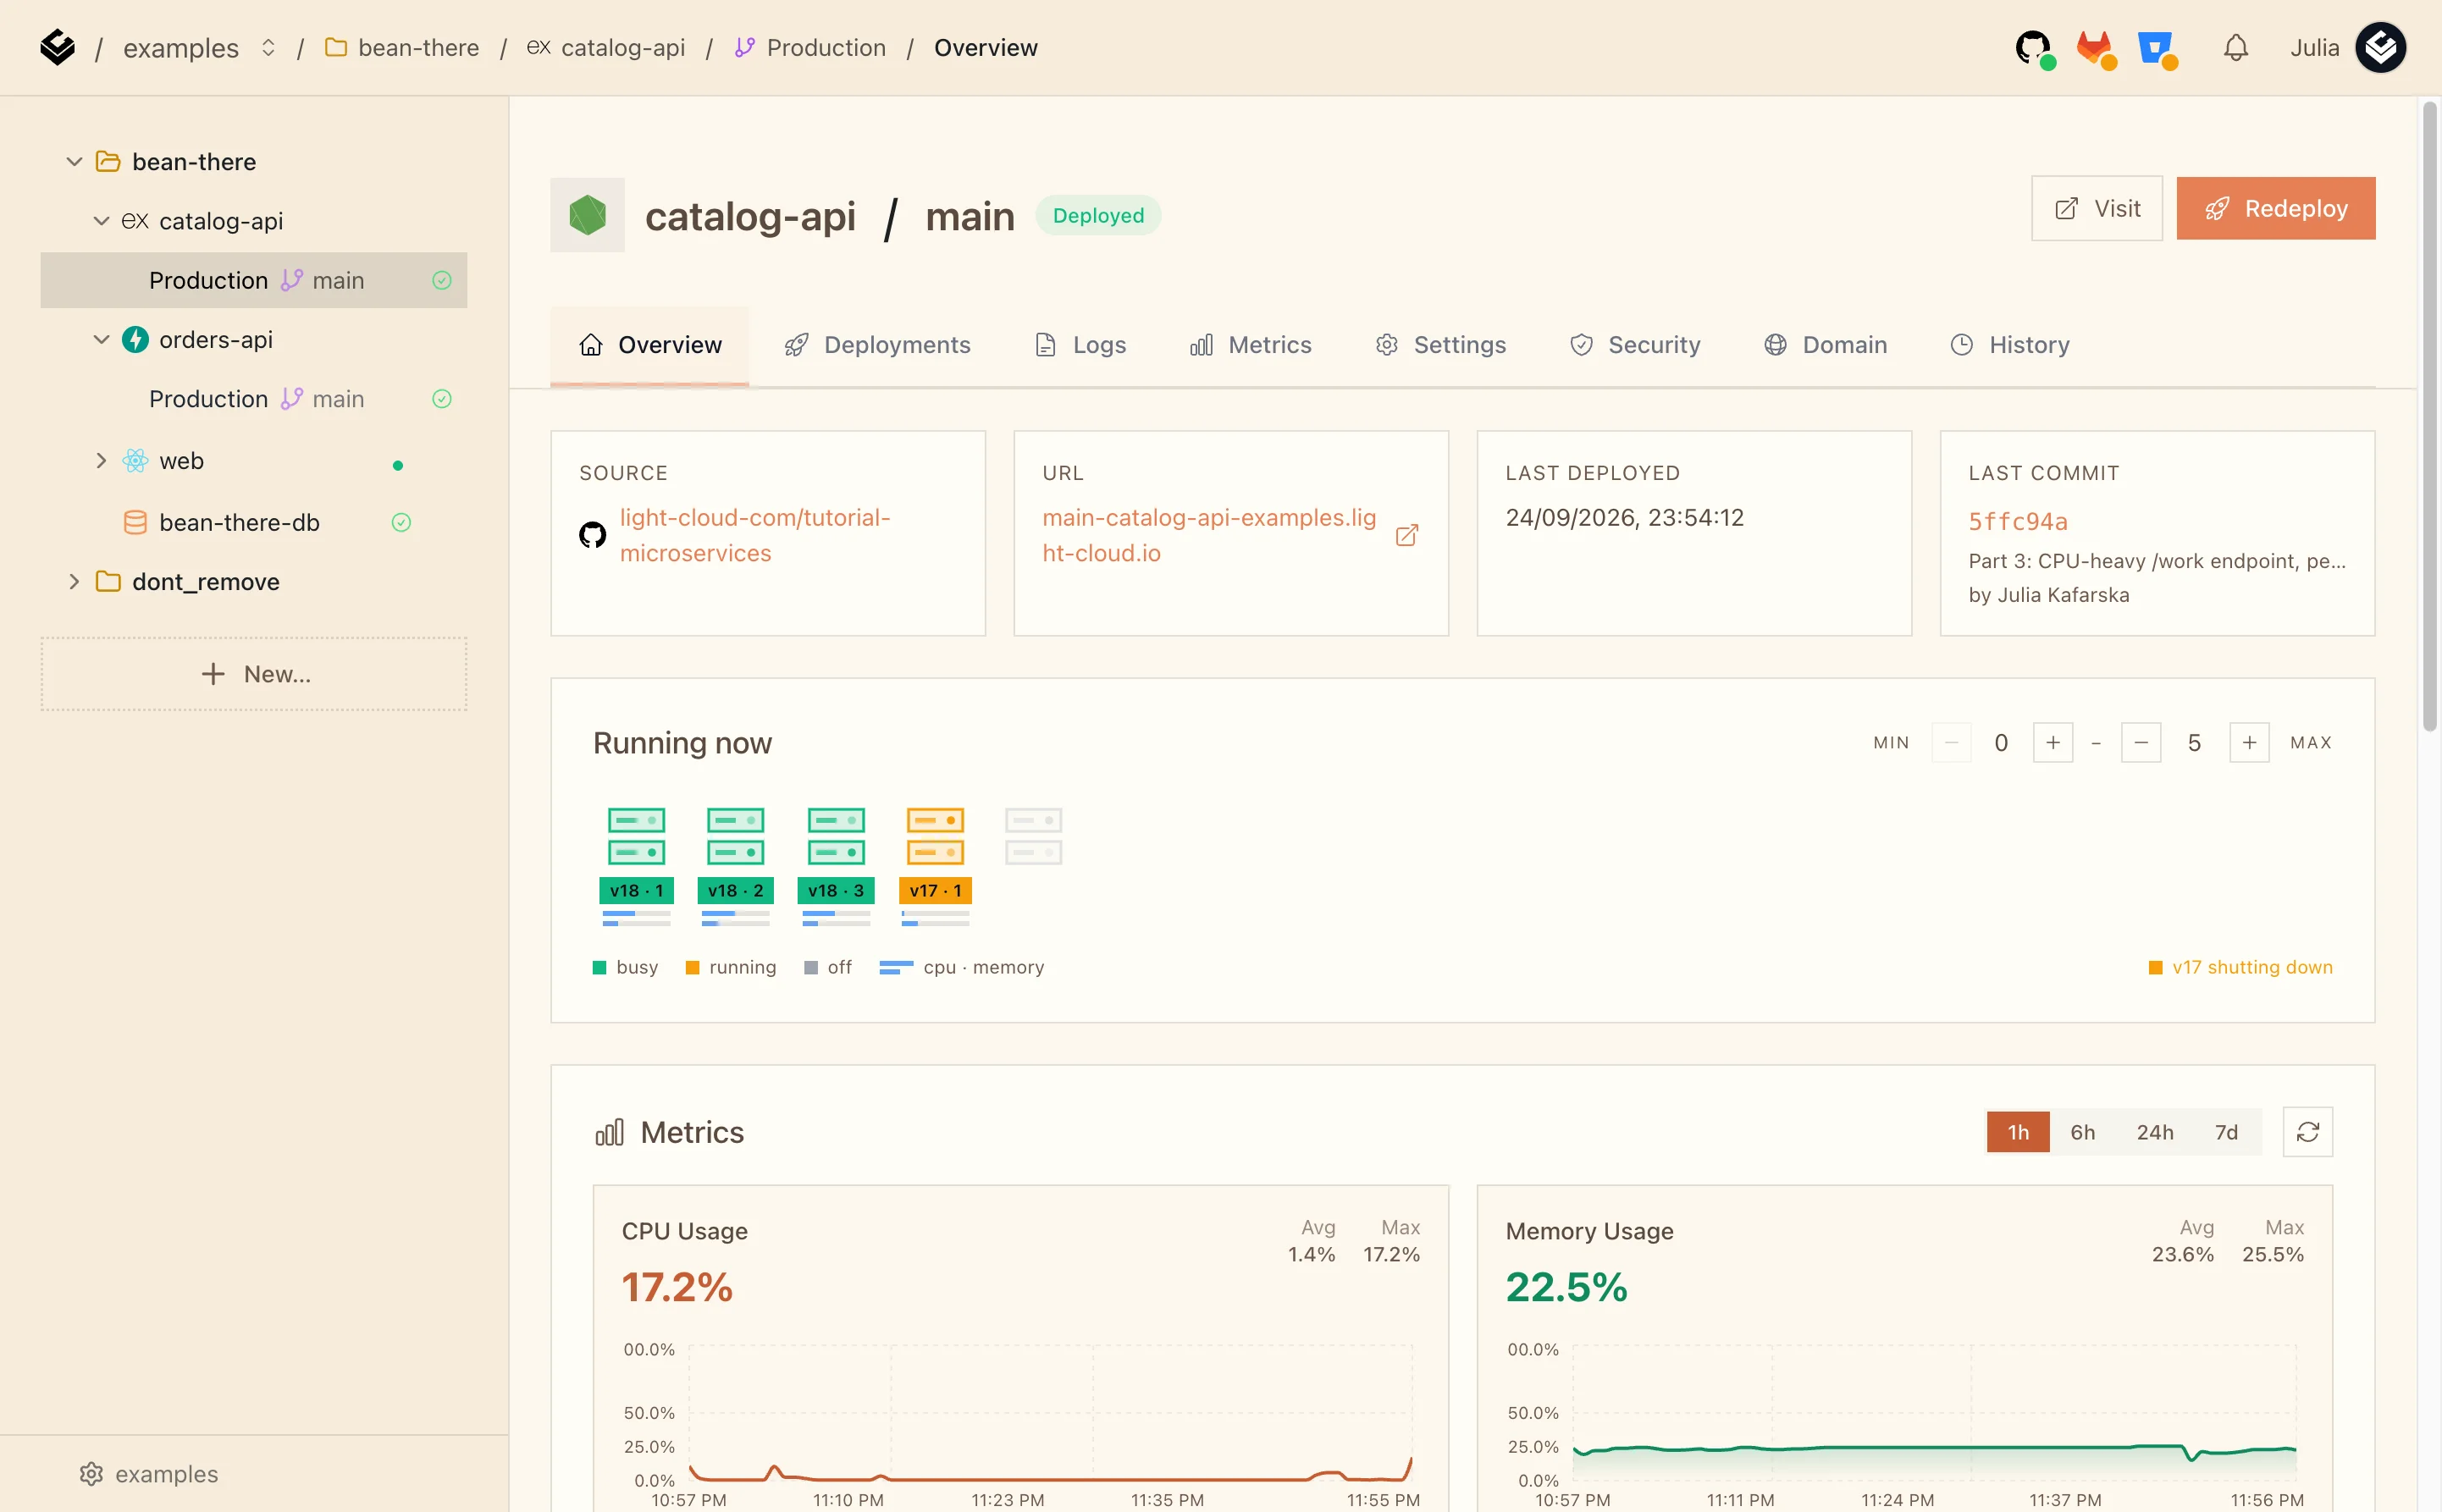
Open catalog-api, then Production. The Running now panel on the Overview tab shows one box per instance and the two limits that matter most:
- MIN is how many instances always run.
0means scale to zero: with no traffic, nothing runs and nothing is billed for compute. - MAX is the ceiling. Light Cloud never runs more instances than this, however busy the service gets.
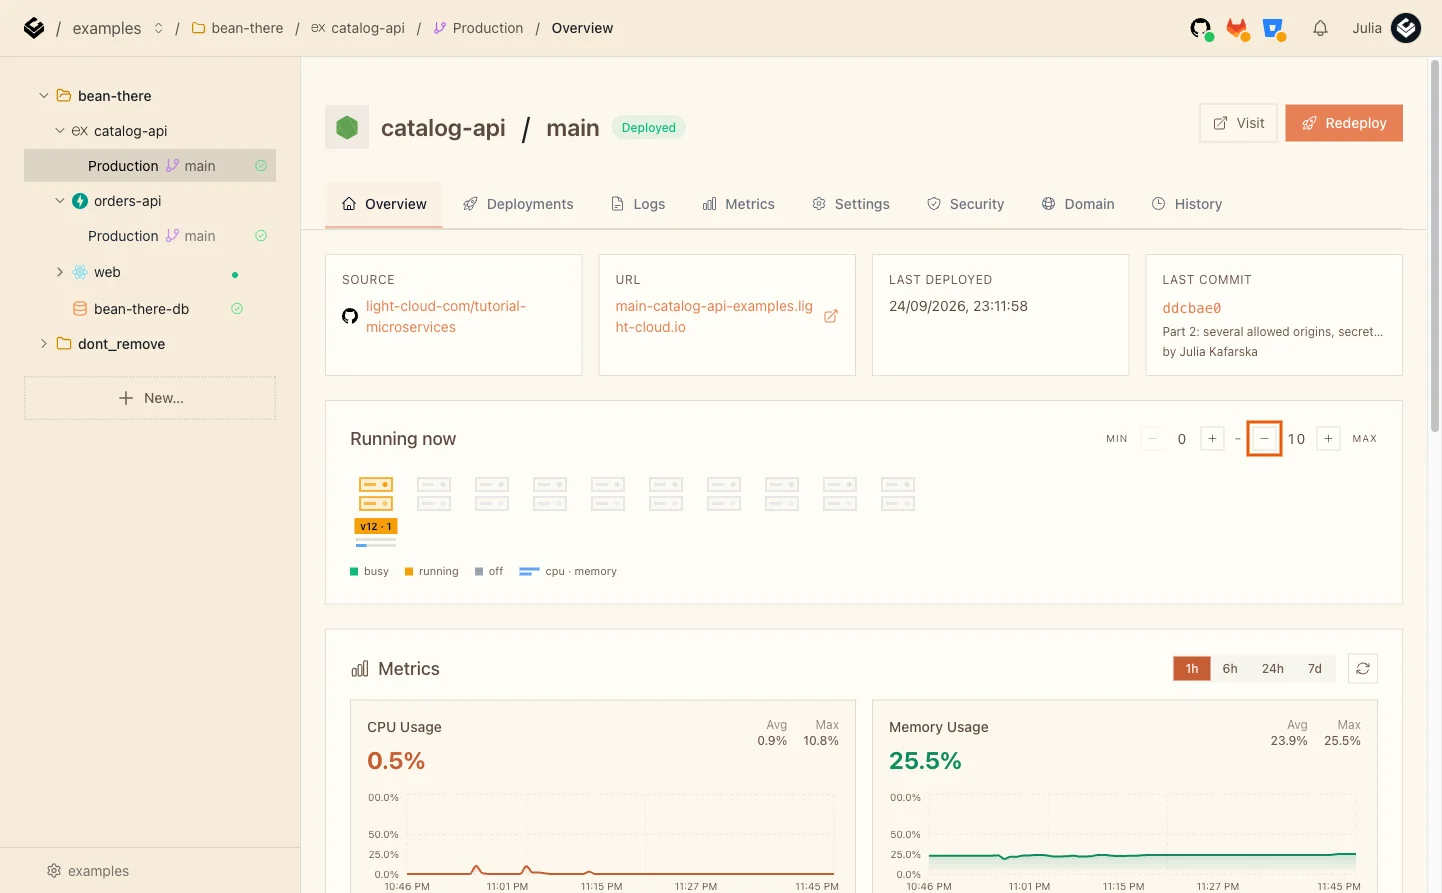
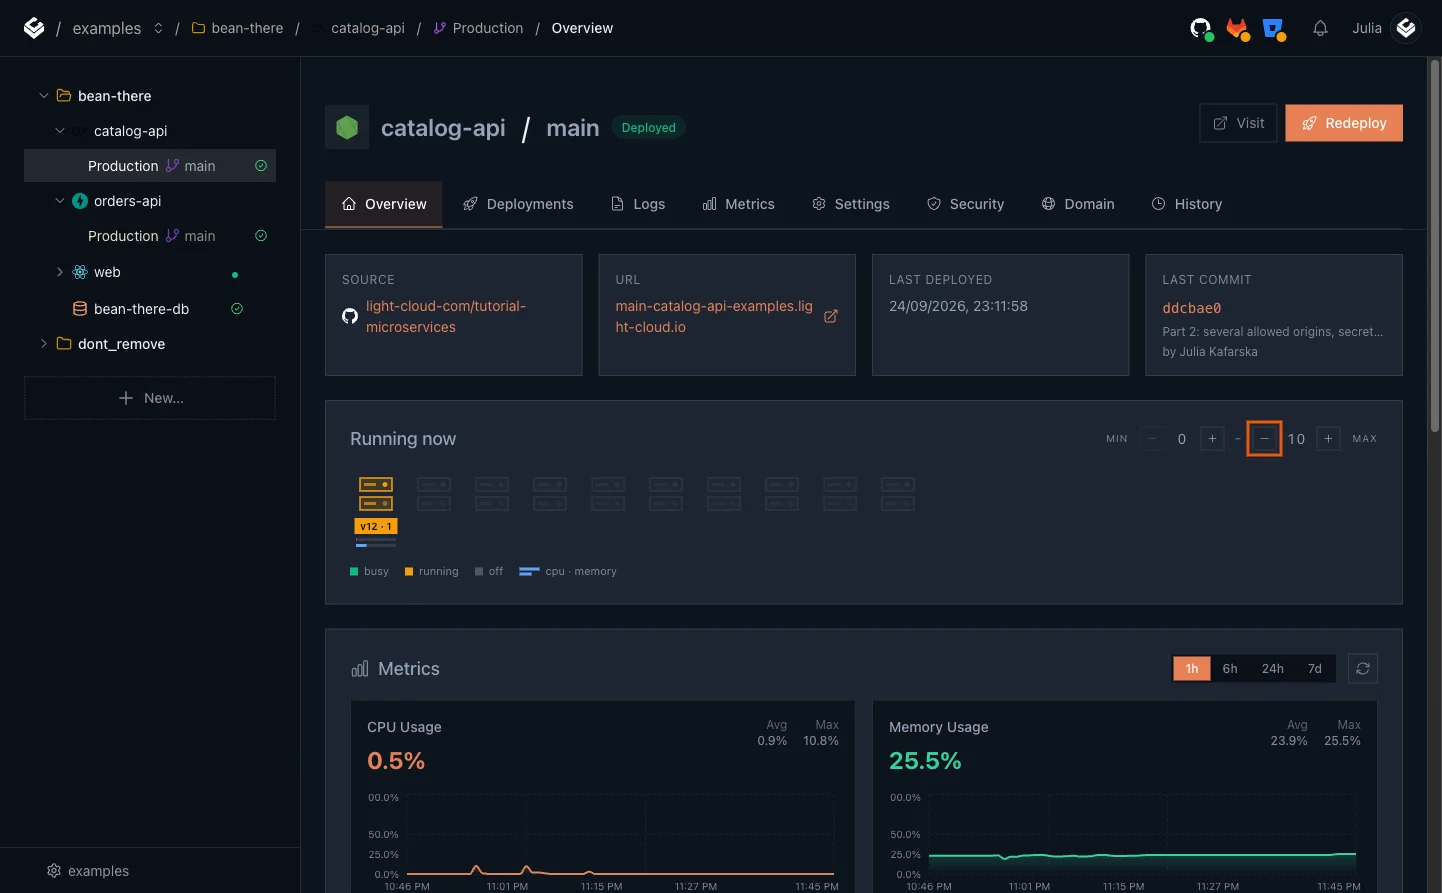
Two more settings live in the app's Advanced section and are chosen when the app is created: Concurrency (how many requests one instance handles at the same time, default 80) and CPU target (the CPU level at which another instance is added, default 80%). You will see why Concurrency matters in Step 6.
Step 3: Set a ceiling of 5 instances
A ceiling keeps a test, or a real traffic spike, from running up usage.
- In Running now, click the - next to MAX until it shows 5. The value moves in steps: 100, 50, 25, 10, 5, 1.
- Wait a few seconds. The change applies immediately, without a deploy.
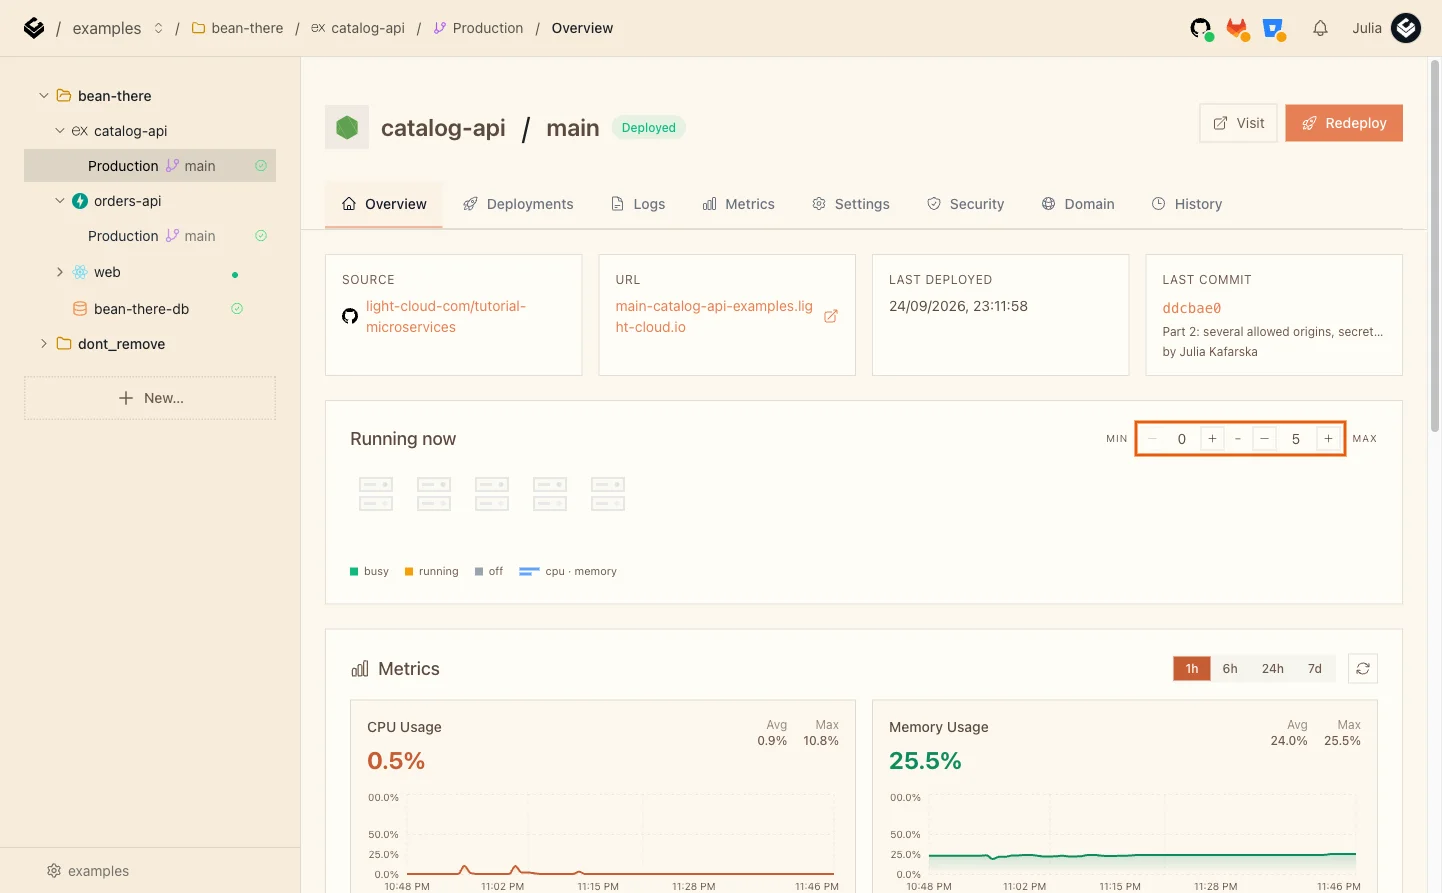
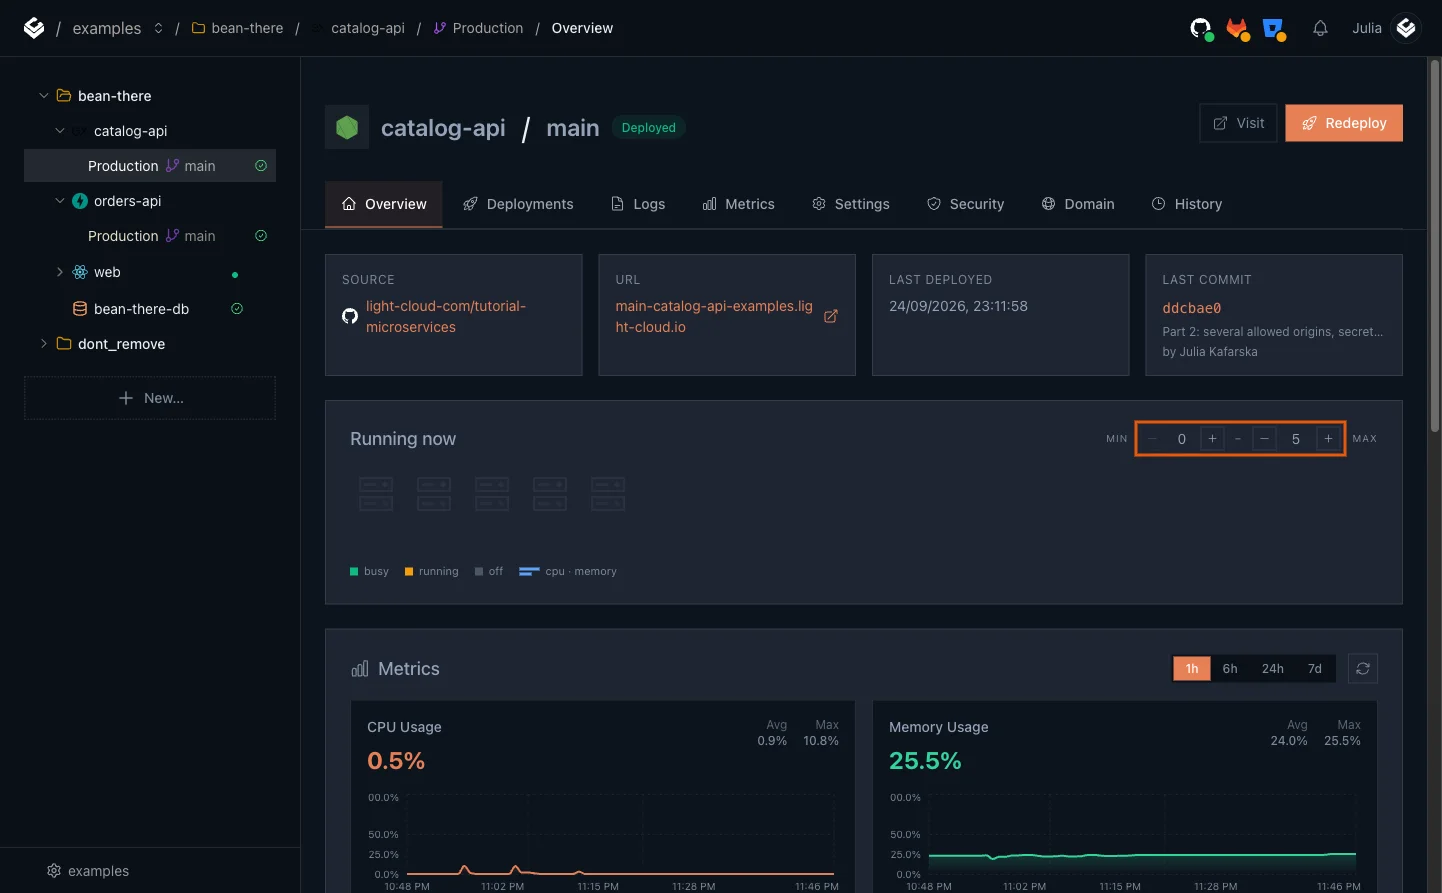
In my run the service had been quiet for a while, so no instance was running at all: scale to zero in action.
Step 4: Install oha
oha sends a steady stream of requests and prints a summary when it finishes.
$ brew install oha
$ oha --version
oha 1.16.0$ curl -L -o oha https://github.com/hatoo/oha/releases/download/v1.16.0/oha-linux-amd64
$ chmod +x oha
$ sudo mv oha /usr/local/bin/
$ oha --version
oha 1.16.0PS> winget install hatoo.oha
PS> oha --version
oha 1.16.0The version you get may be newer; the flags below work the same.
Step 5: Run the load test
One thing first: the Light Cloud edge limits how many requests one IP address can send. In my tests about 10 requests per second from a single machine passed; at 20 per second, half came back as 429 Too Many Requests with Cloudflare error code 1015. A flood of cheap requests from your laptop therefore hits the edge, not your service.
So instead of many cheap requests, send a few expensive ones: 8 per second, each asking for 500 ms of CPU. That is 4 seconds of CPU work arriving every second, more than one instance can do.
$ oha -z 120s -q 8 -c 30 --no-tui "https://main-catalog-api-yourworkspace.light-cloud.io/work?ms=500"PS> oha -z 120s -q 8 -c 30 --no-tui "https://main-catalog-api-yourworkspace.light-cloud.io/work?ms=500"-z 120sruns for two minutes.-q 8sends 8 requests per second, under the edge limit.-c 30allows up to 30 requests in flight, so slow answers do not stop new ones from being sent.
Leave it running and go to the next step. When it ends, oha prints a summary like mine (trimmed):
Summary:
  Success rate:	100.00%
  Total:	120.0027 sec
  Slowest:	15.1210 sec
  Fastest:	0.5572 sec
  Average:	7.5921 sec

Response time distribution:
  10.00% in 0.5748 sec
  50.00% in 7.3343 sec
  90.00% in 15.0382 sec

Status code distribution:
  [200] 440 responses
Step 6: Watch it scale
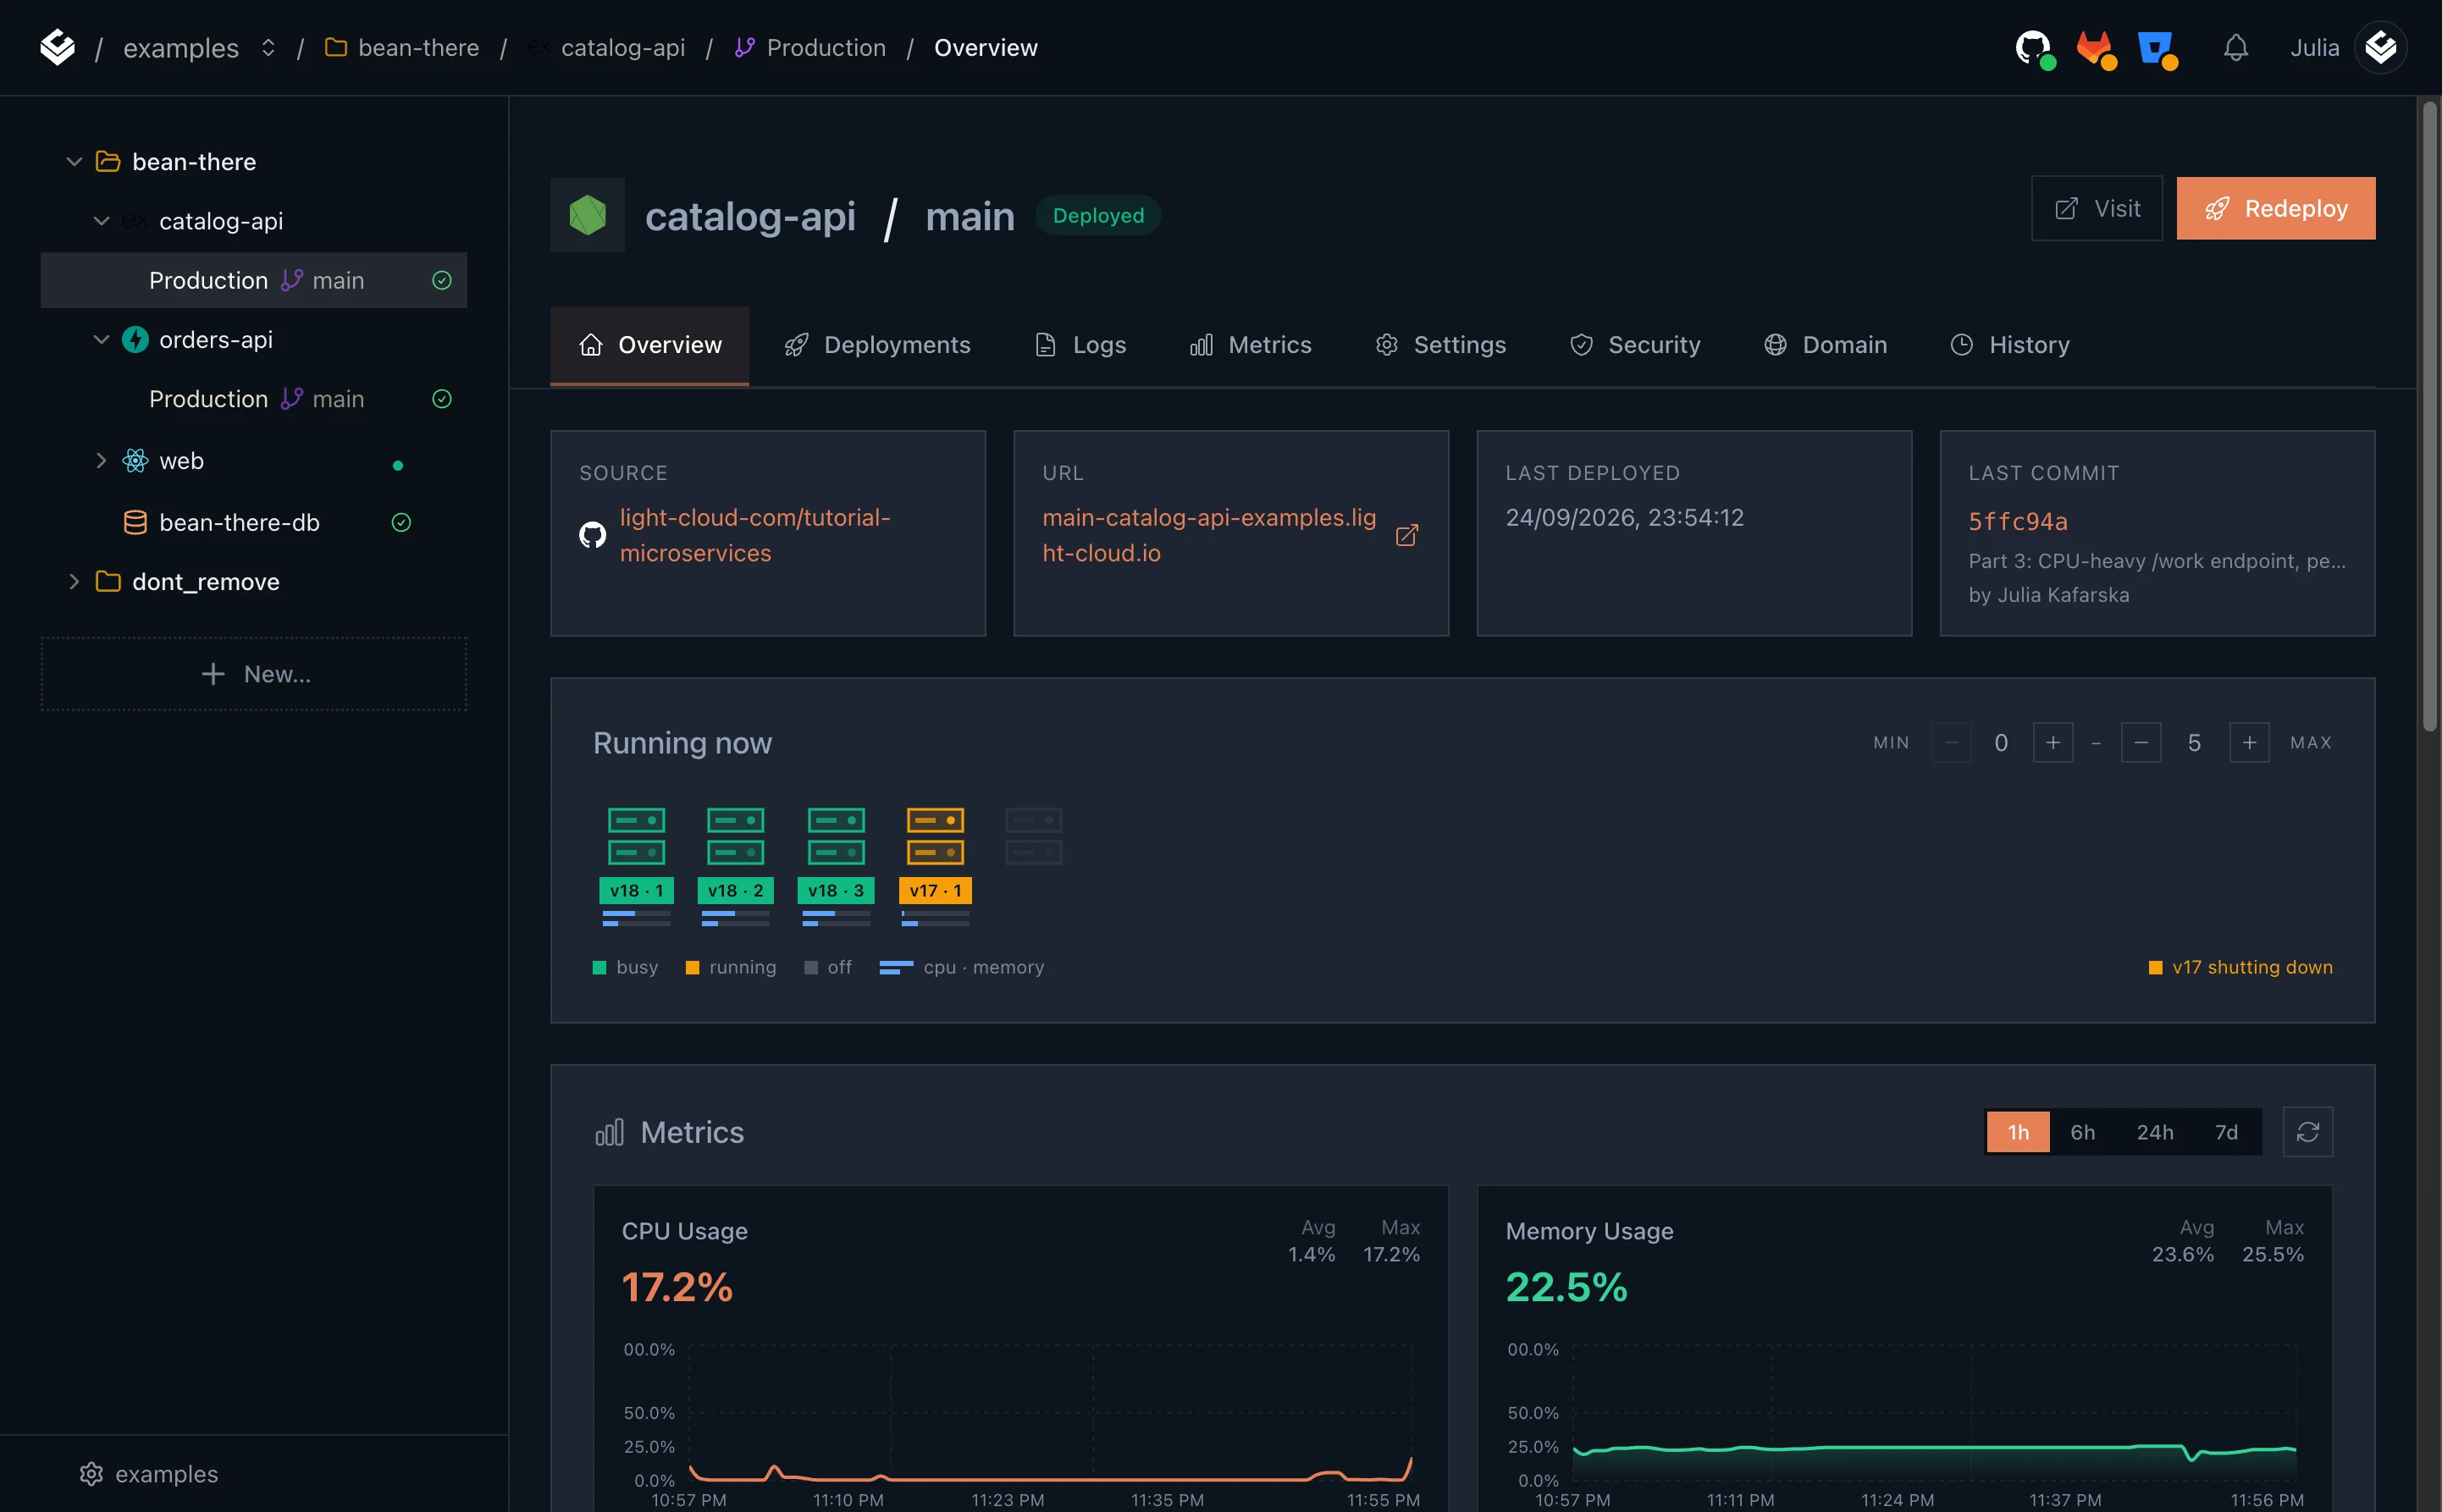
Refresh the Overview tab while the test runs. Within about a minute, Running now fills with busy instances:
You can also see the instances from outside. While the test runs, open https://main-catalog-api-yourworkspace.light-cloud.io/work?ms=50 in your browser and reload it a few times. Each answer says which instance served it:
{"service":"catalog-api","instance":"376f3e18","worked_ms":50}
The instance value changes between reloads: different ids mean different instances. During my test I saw five: 17ab13e6, e881da20, 376f3e18, 523c2dac and c812af69, exactly the ceiling.
The Metrics tab tells the whole story after the fact:
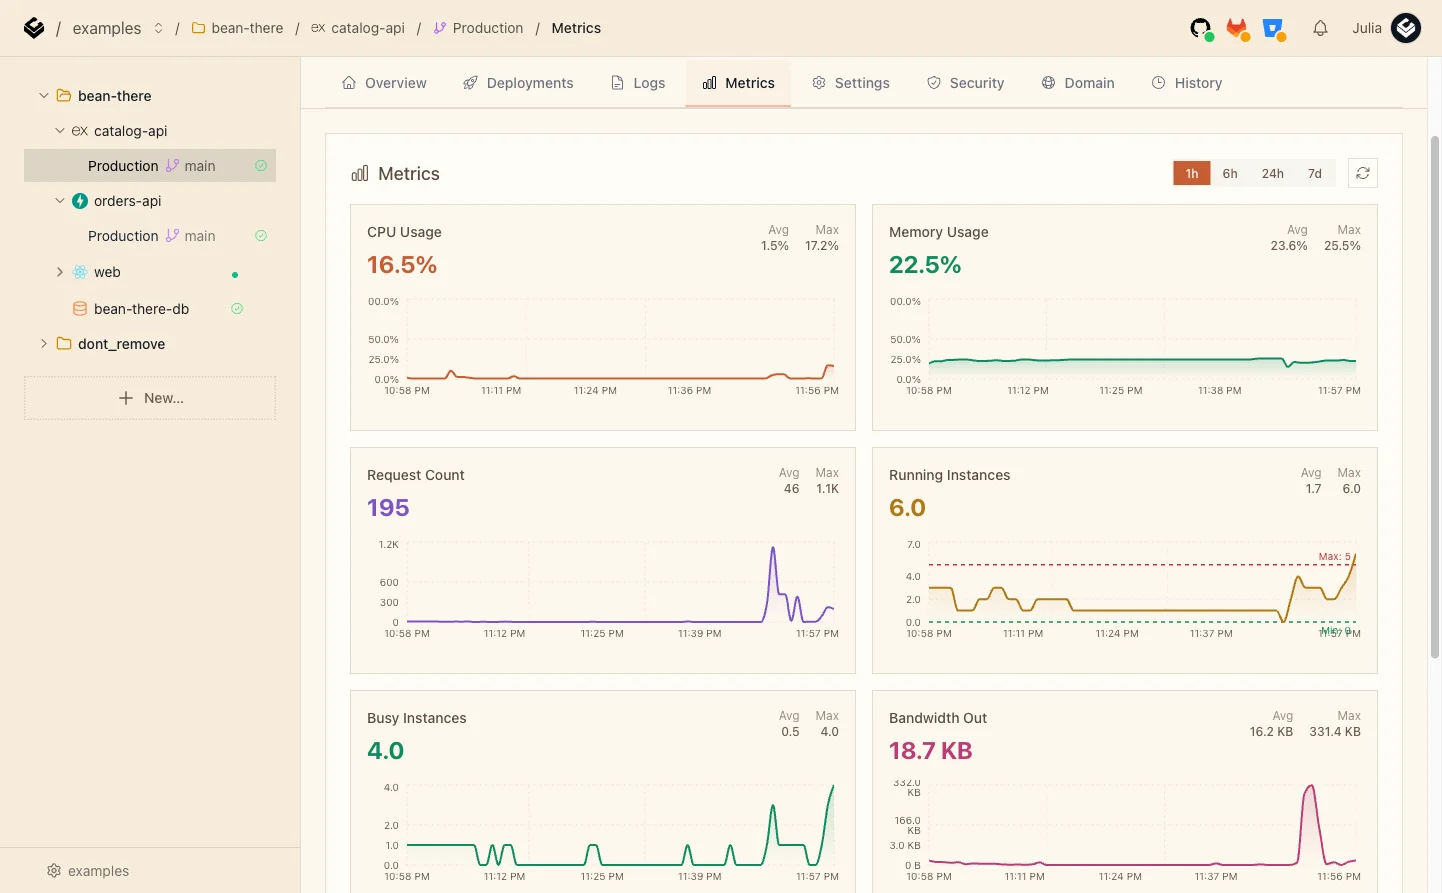
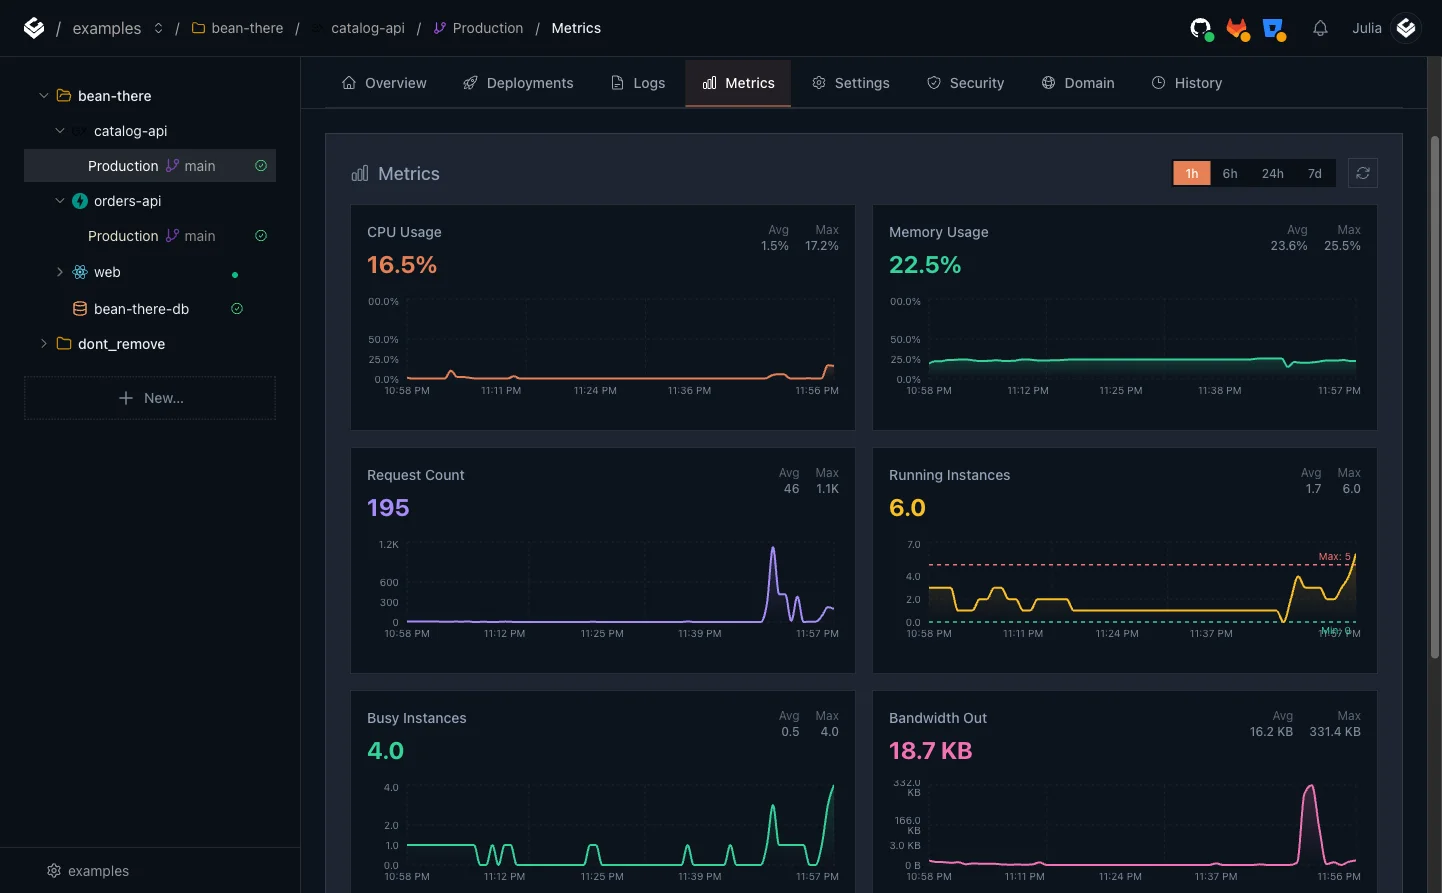
Running Instances climbs to the red Max: 5 line and Busy Instances follows. A few minutes after the test ends, both fall back, and with Min 0 the service returns to zero.
Step 7: Read the results
All 440 requests succeeded, but half of them waited more than 7 seconds for 500 ms of work. The reason is Concurrency.
With Concurrency 80, Light Cloud sends up to 80 requests to one instance before it considers starting another. Node.js runs one piece of JavaScript at a time, so a CPU-heavy request blocks the next: 80 requests of 500 ms each can queue for 40 seconds on a single instance. The CPU target eventually adds instances, which is why the slowest requests are at the start of the test and the last ones were fast again (0.2 seconds in my run).
What to take from it:
- Concurrency 80 suits I/O-bound services, the usual API that waits on a database or another service. catalog-api's
/productsis one of those. - CPU-heavy work wants low Concurrency, so each instance gets only what it can do in parallel and new instances start sooner. Set it in Advanced when you create such a service; it cannot be changed afterwards yet, so a heavy job is a good reason for a separate app.
- Max instances is a cost ceiling, not a speed setting. It only helps if requests are spread across instances early enough.
Step 8: Keep the database safe when scaling out
The first time I pushed catalog-api hard, some requests failed with this in the Logs tab:
error: too many connections for role "u_******"
Every instance opens its own pool of database connections. The Node.js pg driver allows 10 per pool by default, and the shared Dev database allows 10 connections per database user in total. One busy instance could take all of them; two instances were already too many.
Part 3 caps the pool per instance:
// Connections per instance. Every instance opens its own pool, so the total
// is DB_POOL_MAX x running instances; keep it under the database's limit.
const DB_POOL_MAX = Number(process.env.DB_POOL_MAX || 2);
const db = new pg.Pool({ connectionString: process.env.DATABASE_URL, max: DB_POOL_MAX });
The rule of thumb: pool size x max instances + connections used by other services must stay under the database's limit. With catalog-api at 2 connections x 5 instances = 10, orders-api would have nothing left, so on the shared tier you would lower DB_POOL_MAX to 1 or keep Max instances lower. To change it, add DB_POOL_MAX in the environment's Settings, Environment Variables.
If the database still refuses a connection, catalog-api now answers with a clear, retryable error instead of a bare 500:
app.use((err, req, res, next) => {
  const busy = /too many connections|remaining connection slots/i.test(err.message);
  log(req, busy ? "database busy" : "unhandled error", { error: err.message });
  res.status(busy ? 503 : 500).json({ error: busy ? "Database busy, please try again" : "Internal error" });
});
Step 9: See who changed the scaling
Every scaling change is recorded. Open the environment's History tab:
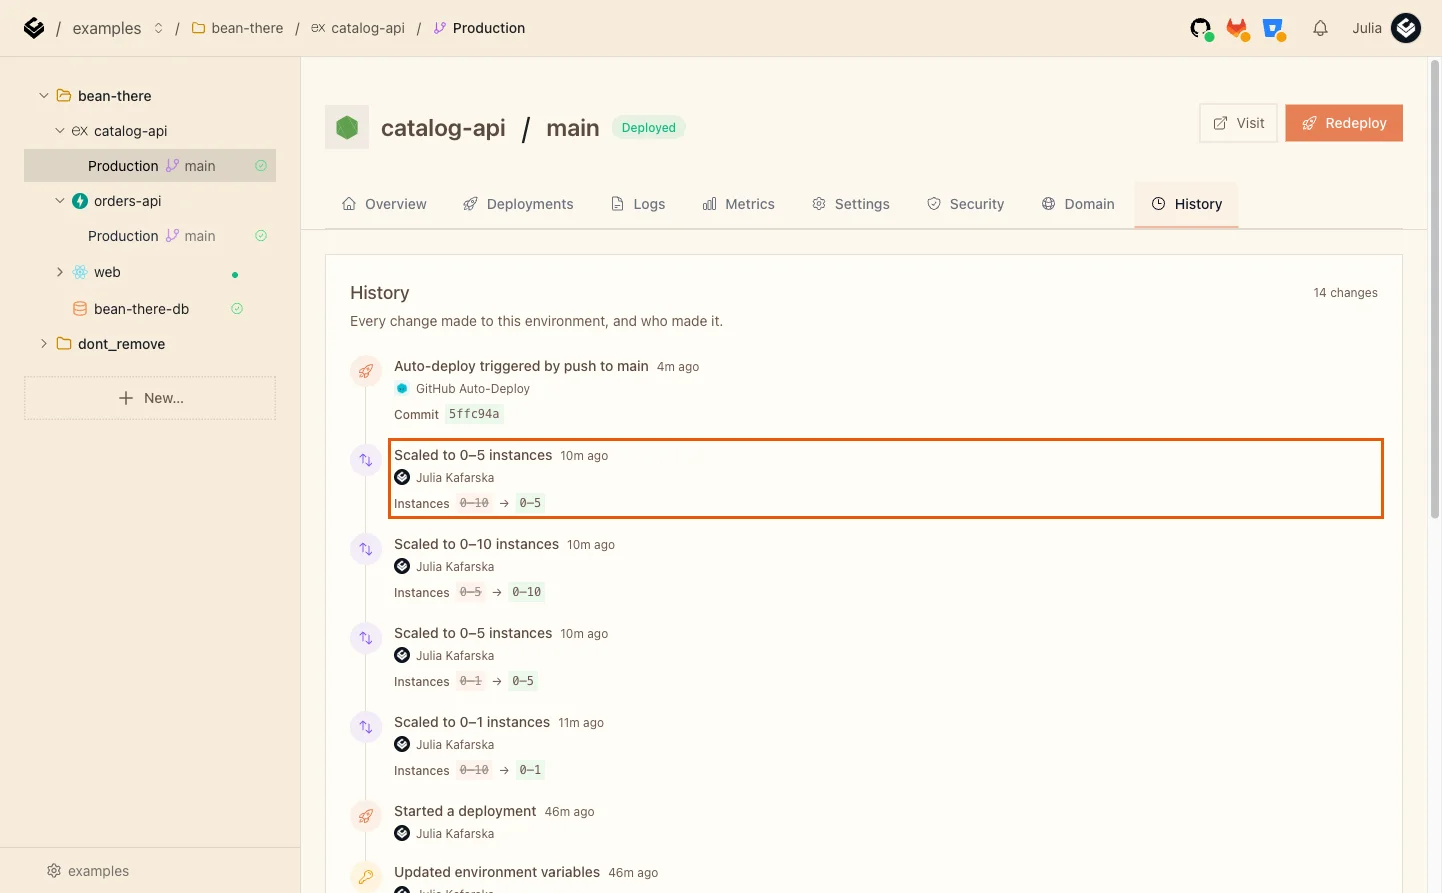
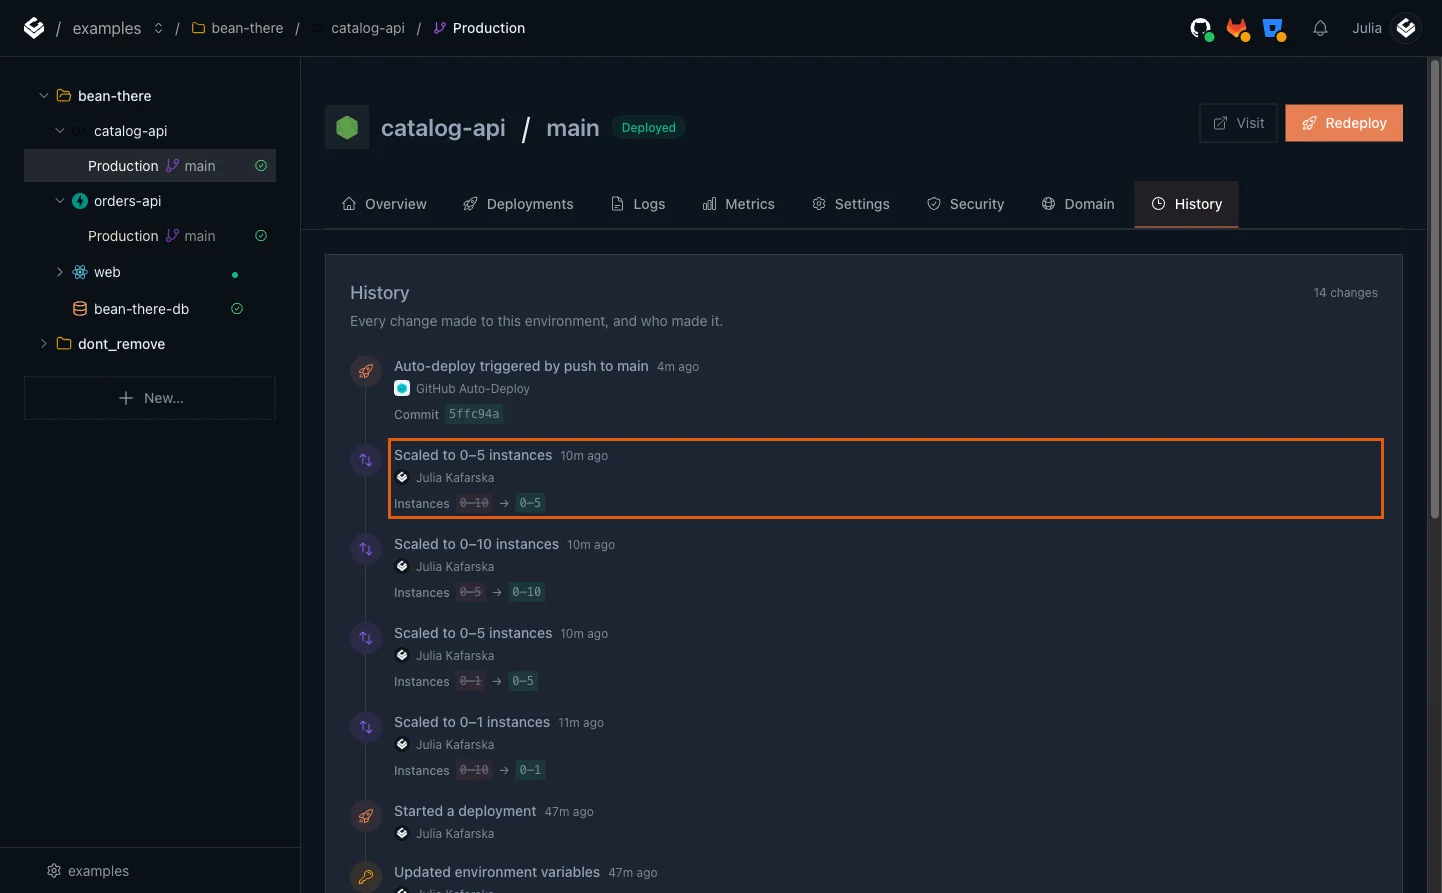
Each entry shows who changed the limits and the range before and after, next to deploys and variable changes.
Troubleshooting
429 Too Many Requests, error code 1015
The edge rate limit for your IP address. Lower -q (8 worked for me, 20 did not) and wait for the retry-after seconds in the response before trying again.
error: too many connections for role
The database ran out of connections because every instance opened its own pool. Lower DB_POOL_MAX, lower Max instances, or both, so that pool size x instances fits the database's limit.
Requests take seconds even though Running now shows several instances
The early requests queued on the first instance before the others started. For CPU-heavy endpoints, create the service with a low Concurrency. For an always-warm service, raise MIN above 0; Part 4 measures what that buys you.
MAX will not go to 3
The stepper moves between 1, 5, 10, 25, 50 and 100. Pick the nearest value that fits your budget.
FAQ
When does Light Cloud add another instance of my service?
When the running instances are busy: each instance takes up to its Concurrency setting of requests at once, and CPU above the CPU target also triggers a new one. New instances stop at your Max instances.
What does Min instances 0 mean?
Scale to zero. When nobody calls the service it runs no instances and uses no compute; the first request after a quiet period starts one.
Why do I get 429 Too Many Requests with error code 1015 during a load test?
The Light Cloud edge limits how many requests one IP address can send. In my test that was about 10 requests per second. Keep a load test from one machine under that rate.
Why does my database say too many connections after scaling out?
Every instance opens its own connection pool, so connections grow with the number of instances. Keep pool size times max instances under the database's limit; the shared Dev database allows 10 per user.
Can I change Concurrency after the app is created?
Not today. Concurrency and CPU target are set in the Advanced section when you create the app. Min and Max instances can be changed at any time.
Next steps
- Part 4: scale to zero or always on? Measuring cold starts, and what setting MIN to 1 buys you.
- Part 2, if you skipped it: allowed origins, secret rotation and timeouts.