Microservices Part 4: Cold Starts vs Always On
Part 4 of Microservices on Light Cloud. Time the first request after a quiet period, keep one instance warm, and see what each choice costs.



On this pageShowHide
To measure a cold start on Light Cloud, leave a service idle until Running now shows no instances, then time the first request with curl -w; to avoid cold starts, set MIN to 1 so one instance always runs. In my test the first request after a quiet period took about 3 seconds for a Node.js API and almost 4 seconds for a Python API, while warm requests took 0.1 to 0.5 seconds.
This is Part 4 of the series. It uses Bean There from Part 1, with catalog-api's MAX already at 5 from Part 3.
What you will build
Two numbers and a decision:
- The cold-start time of catalog-api (Node.js) and orders-api (Python), measured from your own machine.
- The same first request with MIN 1 on catalog-api, for comparison.
- A rule for which services to keep warm, and a timeout between services that fits the numbers.
Source code: github.com/light-cloud-com/tutorial-microservices, tag part-4 (no code changes since Part 3).
Before you start
- Bean There deployed from Parts 1 to 3.
- A terminal with curl (on Windows,
curl.exein PowerShell 7). - Time: a cold start can only be measured after the service has been idle, so this part is mostly waiting. Plan two waits of about 15 minutes each.
Step 1: Let the services scale to zero
Stop calling catalog-api and orders-api, and close any browser tab with the shop open, because the page calls both APIs.
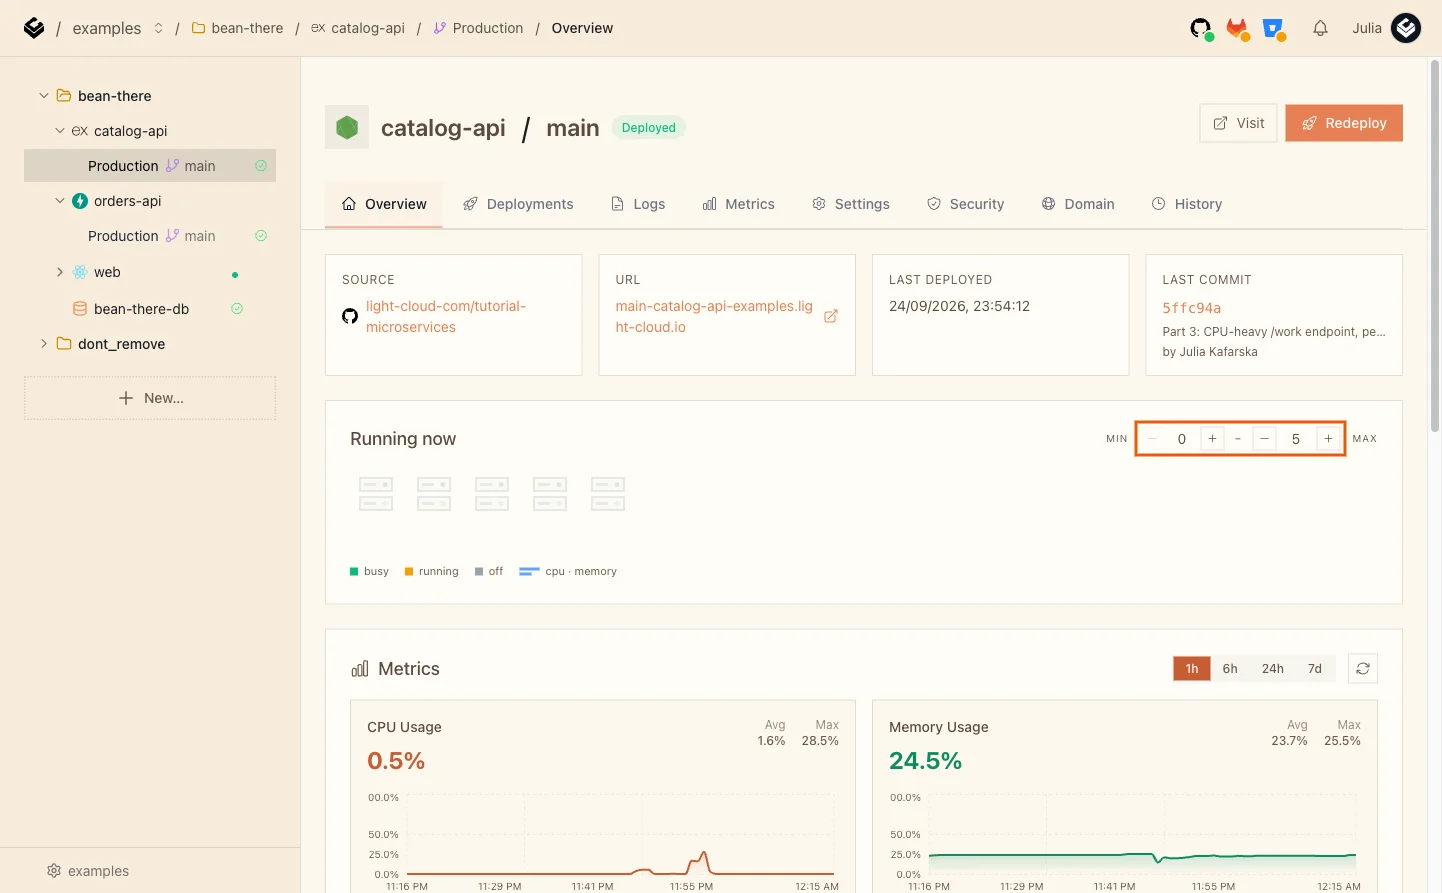
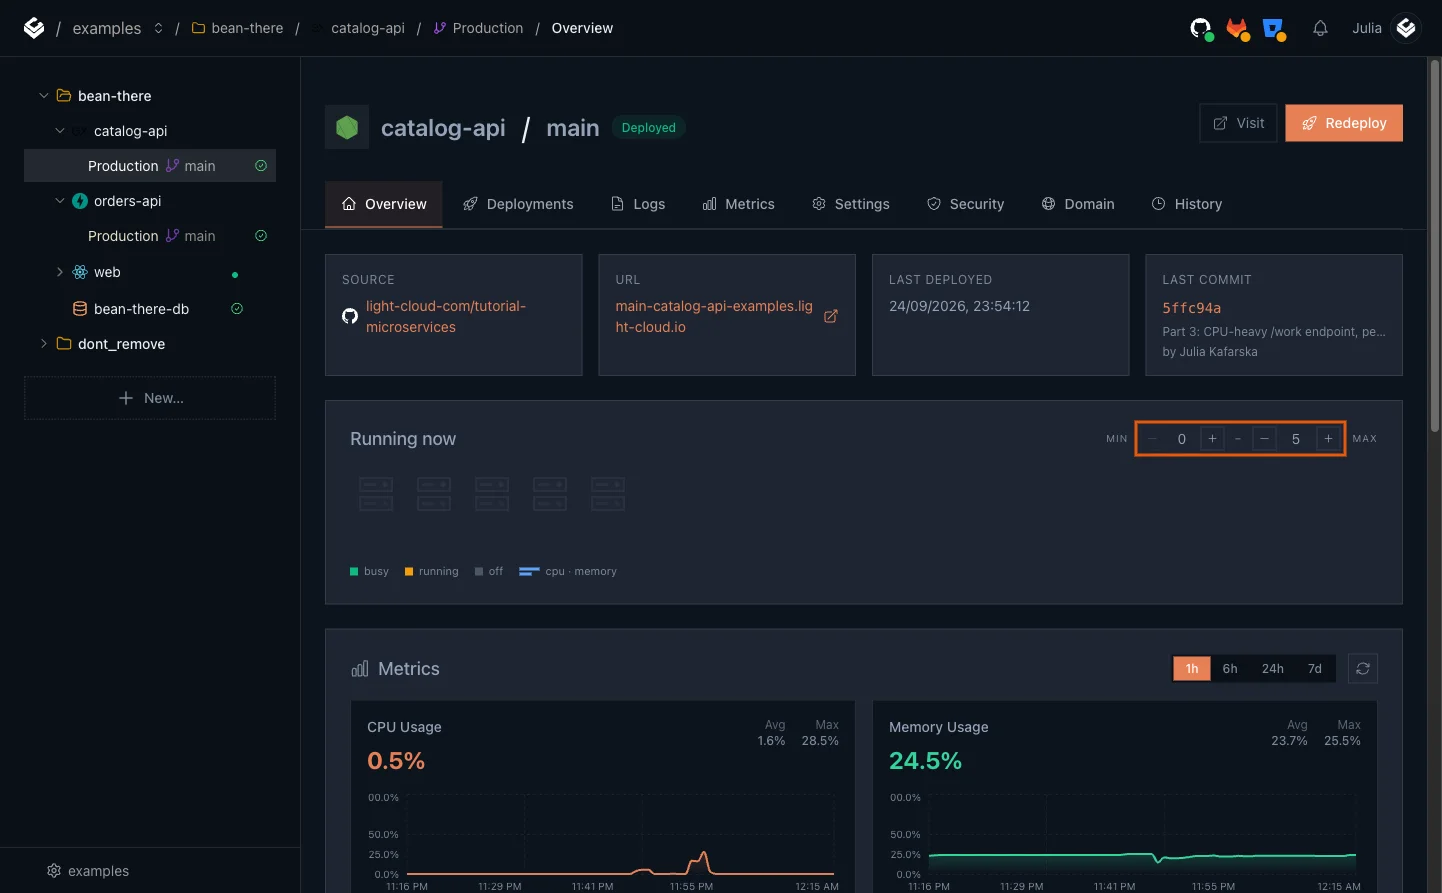
After about 15 minutes, open catalog-api, Production. Running now shows empty boxes: no instance is running, and with MIN 0 none will run until a request arrives.
Step 2: Time the first request
Ask catalog-api for its health and let curl print how long the answer took, in seconds. -o /dev/null hides the answer itself, so only the time is left:
$ curl -s -o /dev/null -w "%{time_total}\n" https://main-catalog-api-yourworkspace.light-cloud.io/health
3.138606PS> curl.exe -s -o NUL -w "%{time_total}\n" https://main-catalog-api-yourworkspace.light-cloud.io/health
3.138606That first request is the cold start: 3.1 seconds. Run the same command again a few times. Mine took 0.49, 0.14, 0.40, 0.43 and 0.13 seconds: the instance is warm now, and the spread is the network between your machine and the service, not the service itself.
Now the same for orders-api, after it has also been idle for 15 minutes:
$ curl -s -o /dev/null -w "%{time_total}\n" https://main-orders-api-yourworkspace.light-cloud.io/health
3.742620PS> curl.exe -s -o NUL -w "%{time_total}\n" https://main-orders-api-yourworkspace.light-cloud.io/health
3.742620The Python service starts a little slower: 3.7 seconds, then 0.14 to 0.47 seconds for the next requests. Your numbers will differ with your location and network, but the shape is the same: one slow request, then fast ones.
Step 3: What a cold start is made of
A cold start is the time from "no instance" to "instance answers". Light Cloud starts a container from your app's image, then your app boots. For catalog-api that boot includes connecting to the database and creating the products table if it is missing, because the server only starts listening after that:
await setUpDatabase();
app.listen(PORT, () => {
  console.log(`catalog-api ${INSTANCE_ID} listening on port ${PORT}, db pool max ${DB_POOL_MAX}`);
});
Anything your app does before it listens adds to every cold start: loading large dependencies, running migrations, warming caches. Keep startup small and do heavy work lazily, after the first request is answered.
Step 4: Keep one instance warm
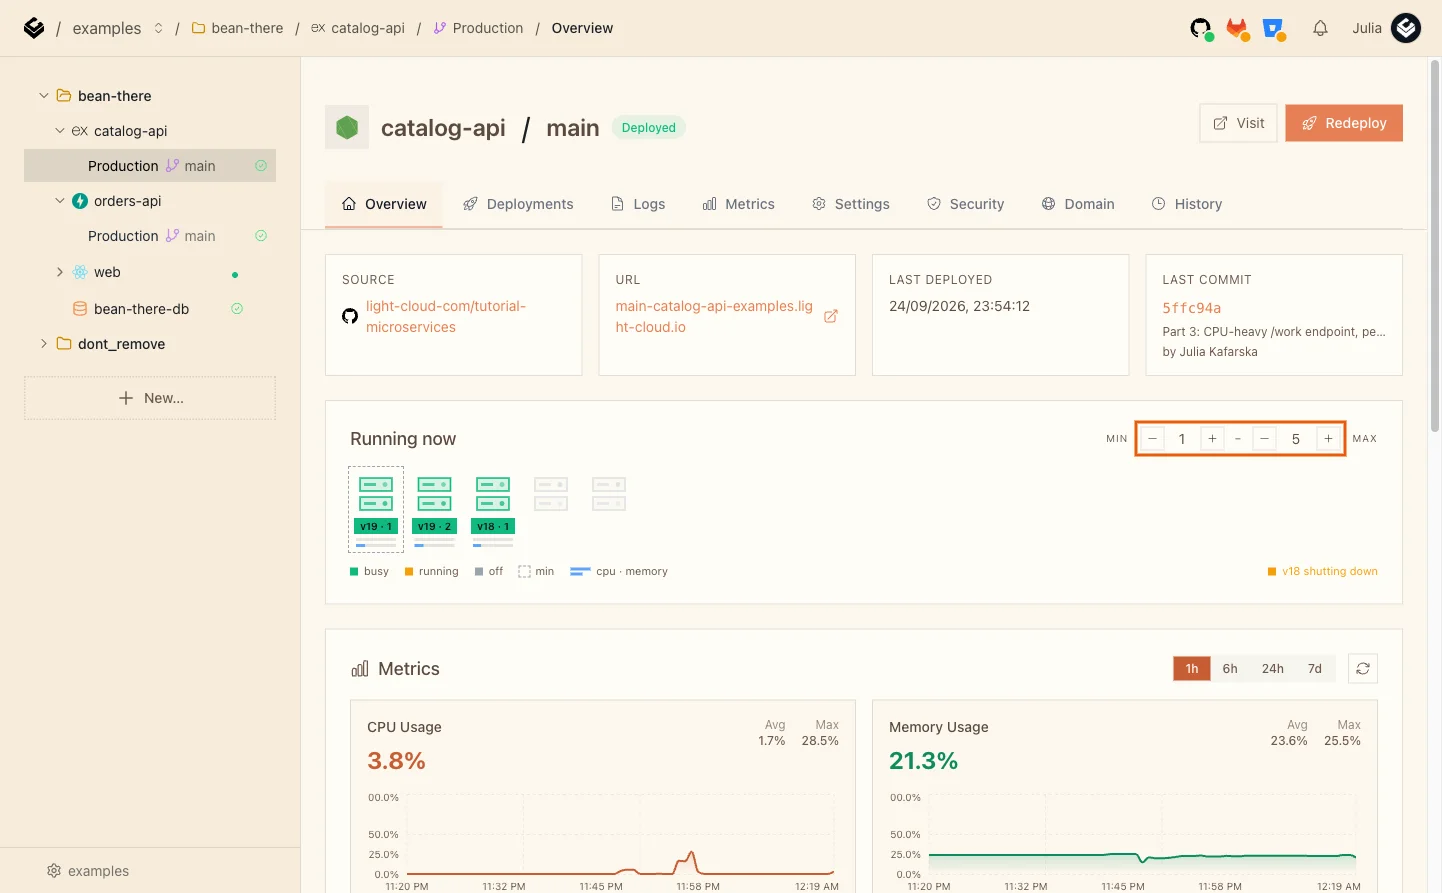
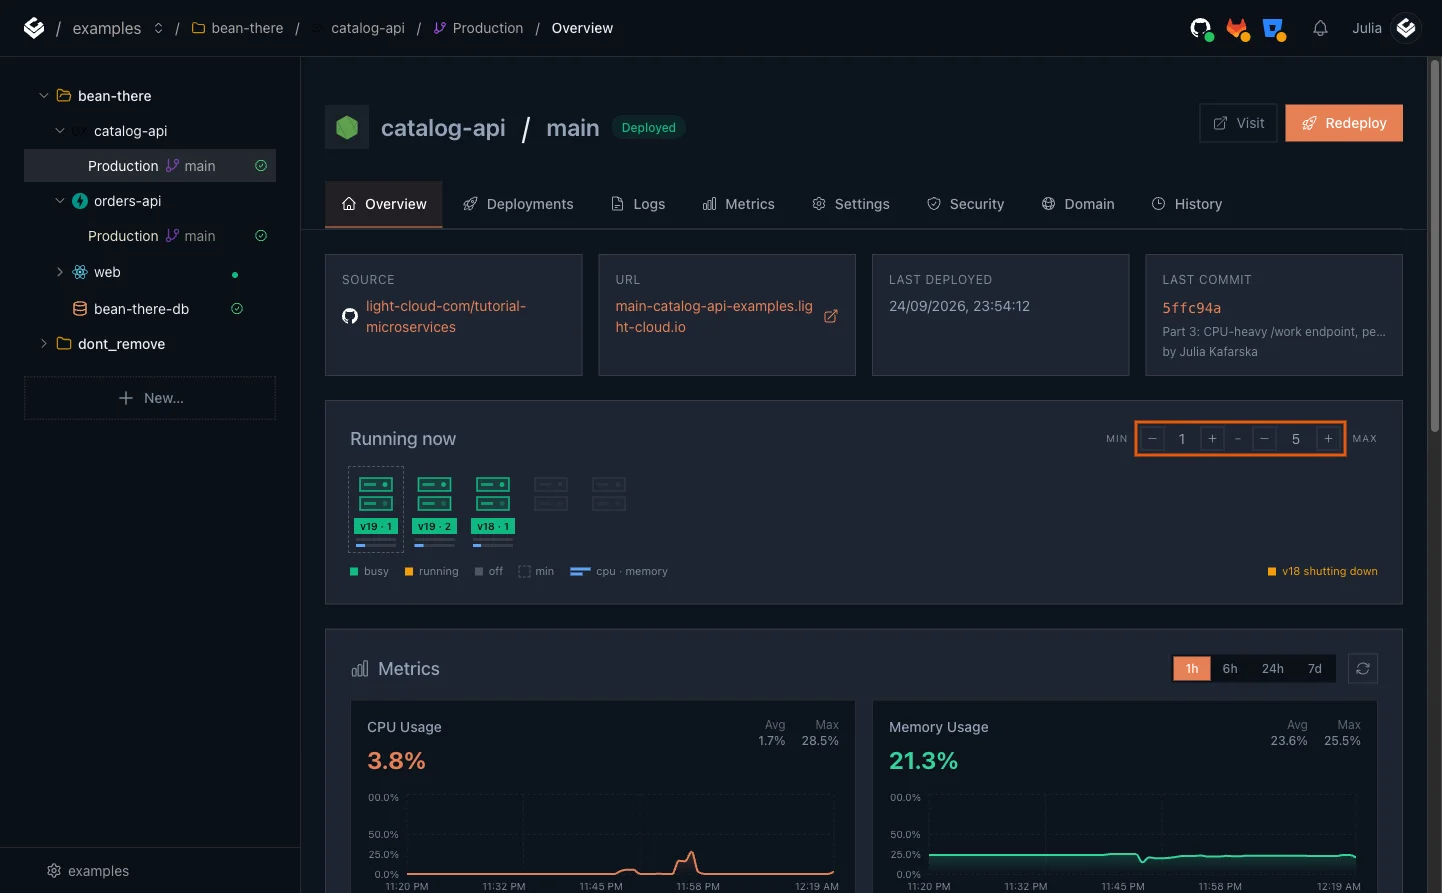
- In catalog-api's Running now, click + next to MIN once, so it shows 1.
- Within a few seconds a new instance starts. The box with the dashed outline is the min instance: it stays even when there is no traffic.
Now leave both services idle for another 15 minutes, and run the first-request timing again for each. In my run:
| Service | First request | Next two |
|---|---|---|
| catalog-api, MIN 1 | 0.94 s | 0.49 s, 0.54 s |
| orders-api, MIN 0 | 3.52 s | 0.49 s, 0.55 s |
With MIN 1, catalog-api answered the first request after the quiet period in 0.94 seconds instead of 3.1. orders-api, still at MIN 0, had scaled to zero again and took 3.5 seconds. The first request of any series is a little slower than the ones after it, warm or not, as the first connection from your machine is set up; the cold start is the difference on top of that.
Step 5: What it costs
Open Billing. Under your workspace, Resources lists every service with what it ran and what that used this cycle:
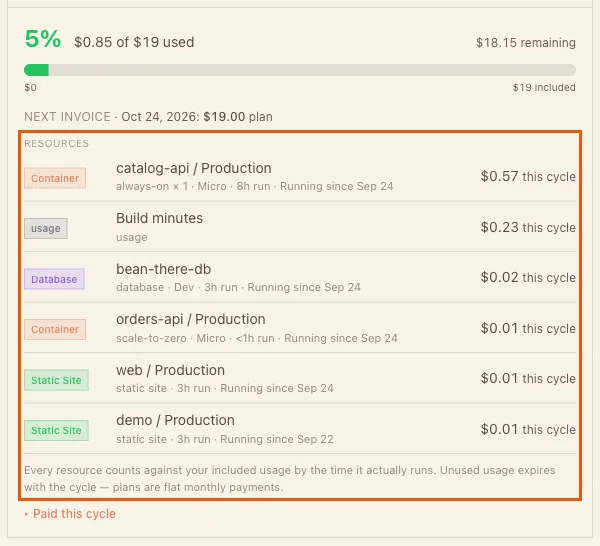
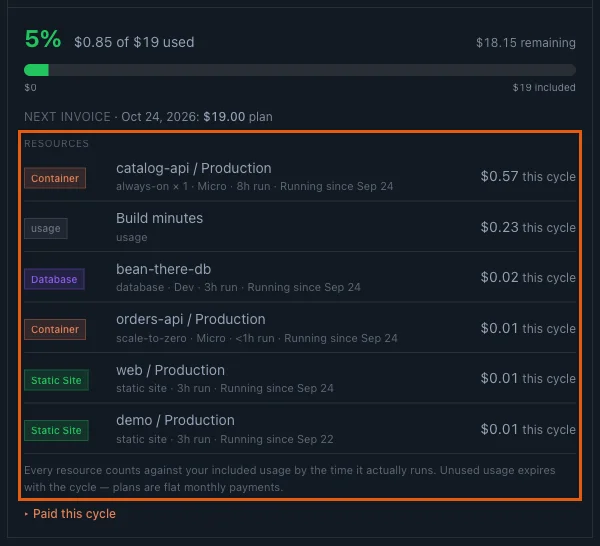
In my workspace, after Parts 1 to 4: catalog-api, which ran the load test and then stayed always on, had used $0.57 of the plan's included usage; orders-api, still scaling to zero, $0.01. Every resource counts against the plan's included usage for the time it actually runs. An always-on instance runs all the time, so it uses included usage every hour, busy or not.
Step 6: Decide what to keep warm
- Keep warm (MIN 1) the services a person waits on: the API behind your checkout, your login, anything a page calls on its first load.
- Let scale to zero everything else: internal jobs, admin tools, rarely used endpoints, preview environments.
- Set timeouts from the numbers. orders-api waits up to
CATALOG_TIMEOUT_SECONDS(5 by default, from Part 2) for catalog-api. A cold catalog-api answered in 3.1 seconds, inside that limit. If your cold starts are longer, raise the timeout or keep the called service warm. - Watch the browser, not just the API. A page that calls two cold services in a row can wait for both.
To go back to scale to zero, click - next to MIN until it shows 0.